
How I Interpret Critical T Values for Statistical Analysis
- Key Takeaways
- My personal approach to statistical testing
- Definition and Significance
- The Role of Hypotheses
- Rejection Regions Demystified
- Why I choose the t-distribution
- Integrating sample size and degrees of freedom
- Step-by-step process for one-tailed and two-tailed tests
- Using quantile functions and distribution tables
- Interpreting Graphs and Shaded Regions
- Practical examples with t-statistics
- Real-world interpretation using a critical value calculator
- Insights from my teaching and research experience
- How do I determine when to reject a null hypothesis?
- Why does sample size influence my choice of distribution?
- What’s the relationship between confidence intervals and these values?
- How do I handle one-tailed vs. two-tailed tests in calculations?
- Can I use online tools instead of manual table lookups?
- What mistakes do beginners often make with rejection regions?
- How does degrees of freedom change with different data structures?
I still remember staring at my first hypothesis test results, unsure whether the numbers told a clear story. That’s when I realized how much critical values matter—they’re like guardrails on a winding road, guiding decisions in uncertain terrain. Whether you’re analyzing survey data or clinical trial results, these thresholds separate “maybe” from “probably not.
My approach starts by viewing critical values as decision boundaries. When my test statistic crosses this line, it signals that the observed effect isn’t just random noise. For t-distributions, which I use with smaller samples or unknown population variances, these cutoffs adapt based on degrees of freedom. This flexibility makes them indispensable for real-world analysis where perfect data rarely exists.
I’ve learned to appreciate how this method streamlines conclusions. Instead of getting lost in p-values, comparing a calculated statistic to its critical counterpart offers straightforward yes/no guidance. But context always matters—the chosen significance level and test direction (one-tailed vs. two-tailed) directly shape where those boundaries fall.

How I Interpret Critical T Values for Statistical Analysis
Learn how I interpret Critical T values for accurate statistical analysis in my latest guide. Discover the steps I take to ensure reliable results.
Key Takeaways
- Critical values act as decision thresholds in hypothesis testing
- T-distribution cutoffs adapt based on sample size through degrees of freedom
- Comparison with test statistics often replaces p-value calculations
- Significance level and test type determine boundary positions
- Essential for small samples or unknown population variances
Introduction to Critical T Values
Early in my career, I discovered that critical values offer a straightforward path through complex data analysis. My method revolves around treating these thresholds as decision gatekeepers—if the test statistic crosses them, the results become statistically meaningful. This approach cuts through ambiguity, especially when working with limited sample sizes or uncertain population variances.

My personal approach to statistical testing
I always start by setting the significance level—usually 0.05 for general research. This step defines how much risk I’m willing to take in rejecting a true null hypothesis. For high-stakes scenarios like medical trials, I’ll tighten it to 0.01. The chosen level directly shapes the rejection region boundaries on the t-distribution curve.
Here’s how I structure my workflow:
| Step | Action | Tool Used |
|---|---|---|
| 1 | Define hypothesis & test type | Research question |
| 2 | Set significance level | α (0.05/0.01) |
| 3 | Calculate degrees of freedom | Sample size – 1 |
| 4 | Determine critical value | T-table or software |
Choosing between one-tailed and two-tailed tests comes next. This decision impacts where rejection regions appear on the distribution. I’ve found visual learners grasp this concept faster when I sketch the curve with shaded areas showing where results become statistically significant.
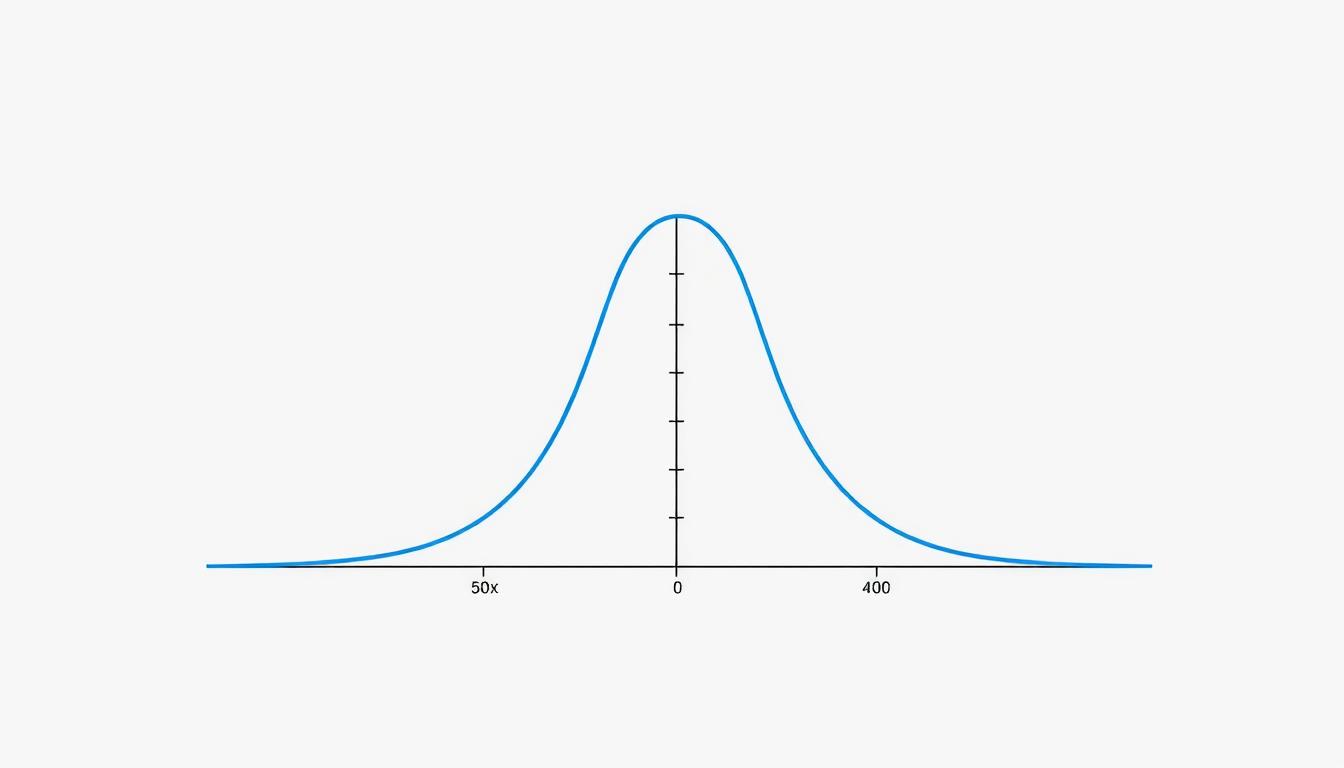
My approach prioritizes understanding the t-distribution’s unique shape for small samples. Unlike the normal curve, it has heavier tails—meaning critical values sit farther from the mean. This adjustment prevents overconfident conclusions from limited data.
Understanding Critical Values in Statistical Testing
Hypothesis testing becomes actionable when we establish clear decision rules. My workflow revolves around three core concepts that transform abstract probabilities into concrete conclusions.
Definition and Significance
I view critical values as probability gatekeepers. These thresholds mark where results shift from “likely random” to “statistically meaningful.” For a 0.05 significance level, they define the outermost 5% of a distribution where unusual outcomes live.
The Role of Hypotheses
The null hypothesis assumes no effect exists—like claiming a coin is fair. The alternative suggests something different, like a weighted coin. These opposing claims determine how we set our boundaries.
“Statistical tests are trials where data acts as evidence against the null hypothesis.”
Elementary Statistics, 12th Edition
Rejection Regions Demystified
I visualize rejection areas as danger zones for the null hypothesis. If my test statistic lands here, the evidence becomes too strong to ignore. The table below shows how test types change these zones:
| Test Type | Significance Level | Critical Values |
|---|---|---|
| One-tailed | α = 0.05 | +1.645 or -1.645 |
| Two-tailed | α = 0.05 | ±1.96 |
Heavier shading on distribution graphs helps me spot where results become noteworthy. This approach prevents misinterpreting borderline cases—a common pitfall for newcomers.
Using Critical T in Hypothesis Testing
Working with real-world data taught me one truth: sample limitations shape statistical choices. When analyzing experimental results, I prioritize methods that account for uncertainty—especially when dealing with incomplete information.

Why I choose the t-distribution
I reach for the t-distribution when facing two common scenarios: small sample sizes or unknown population variance. Unlike the normal curve, its heavier tails act as safety buffers against false positives. This adjustment matters most when working with 30 or fewer data points.
The formula I use—t* = (x̄ – μ)/(s/√n)—transforms raw data into standardized values. These scores follow a t-distribution pattern determined by degrees of freedom (n-1). For sample sizes above 30, the results start mirroring normal distribution behavior.

Specifications
- Type: Natural testosterone-support dietary supplement (capsule form).
- Form: Easy-to-swallow vegetable-based capsules (clear, all‑natural, no gelatin or fillers)
- Usage: Take 2 capsules once daily (morning) with a glass of water (a “10‑second solution” each day).
- Key Ingredients: Proprietary blend including Tongkat Ali (Eurycoma longifolia), Diindolylmethane (DIM), and Acacetin (from Turnera diffusa). These botanicals are clinically studied for boosting natural testosterone production and blocking excess estrogen (aromatase) in the body.
- Target Benefits: Formulated to support healthy testosterone levels, hormone balance and male vitality. Users may experience increased libido, sexual performance, energy, motivation, mood and confidence as T levels improve(Balanced hormones can also aid physical performance and lean muscle maintenance over time.)
- Bottle Size: Each bottle contains a 30-day supply (60 capsules at 2/day)
Nullam et nibh ac nulla commodo ultricies ac in dui. Mauris mollis leo vel nulla scelerisque lobortis. Nam ultrices dui eget suscipit euismod. Duis id metus condimentum, interdum mauris a, venenatis sapien. Mauris felis libero, ultricies vitae dolor sit amet,
Integrating sample size and degrees of freedom
My analysis always begins by calculating degrees of freedom. This number links directly to sample size through n-1, shaping the t-distribution’s width. Smaller samples create wider spreads, pushing critical values farther from the mean.
Here’s how I visualize the relationship:
- 15 samples → 14 degrees of freedom → Critical value ±2.145
- 30 samples → 29 degrees of freedom → Critical value ±2.045
This pattern explains why larger studies need less extreme thresholds. As degrees of freedom increase, the distribution tightens—like focusing a camera lens for sharper conclusions.
Calculating Critical Values and Degrees of Freedom
My first encounter with t-distribution tables felt like deciphering an ancient code. Through trial and error, I developed a systematic method to find critical values that balances mathematical rigor with practical application. This process hinges on understanding how test types and sample sizes shape outcomes.
Step-by-step process for one-tailed and two-tailed tests
I start by clarifying the test direction. A one-tailed test examines effects in a single direction, while a two-tailed test checks both extremes. This distinction determines whether I need one or two boundary values.
| Test Type | Significance Level | Quantile Formula |
|---|---|---|
| One-tailed | α = 0.05 | tα, df |
| Two-tailed | α = 0.05 | ±tα/2, df |
For a sample of 5 measurements (df=4) at α=0.05, my table lookup reveals 2.132 as the critical value. This number marks where results become statistically noteworthy.
Using quantile functions and distribution tables
I treat t-tables like GPS coordinates. The degrees of freedom guide me to the correct row, while significance levels point to the proper column. For digital calculations, I use inverse t-distribution functions that automate this search.
“Quantile functions transform probabilities into concrete thresholds – the Rosetta Stone of statistical testing.”
Statistical Methods Manual
When working manually, I double-check three elements:
- Test direction (left/right/both tails)
- Accurate degrees of freedom calculation
- Alignment between α values and column headers

Pros
- Natural, research-backed formula: Uses potent botanicals like Tongkat Ali, DIM and Acacetin to safely boost testosterone and manage estrogen
- Supports vitality: Aims to improve libido, energy, stamina and mental focus without synthetic hormones (the product “only support[s]” your body’s own hormones)
- High-quality manufacturing: Made in an FDA-registered, GMP facility; gluten-free with no fillers or additives
- Easy dosing: Only 2 capsules each morning; part of a quick daily routine
- Risk-free trial: Backed by a 60-day money-back guarantee, so users can try it without commitment.
Cons
- Price: Retail price is about $69 per bottle (30-day supply), which is higher than some multivitamins.
- Consistency needed: Best results may require a 60-day trial of daily use.
- Limited availability: Sold only online through the official website (no retail or pharmacy distribution).
- Restrictions: Not for use by women who are pregnant/nursing or by men under 18
- Allergy warning: Generally well-tolerated (“excellent safety record, no significant side effects”), but like any supplement, rare allergies to ingredients could occur.
Visualizing Rejection Regions and Test Statistics
Graphs transformed my statistical analysis when numbers alone left me questioning. I now use shaded areas to visually map decision boundaries, turning abstract thresholds into actionable insights. This method helps beginners grasp complex concepts faster than raw calculations.
Interpreting Graphs and Shaded Regions
I start by drawing the t-distribution curve, marking critical values as boundary lines. Red shading shows where results become statistically significant, particularly when I need to reject null hypothesis outcomes. For a right-tailed test with α=0.05, the shaded region begins at 1.7613 and extends rightward, allowing me to find critical value thresholds easily.
Here’s how I compare test types:
| Test Direction | Critical Value | Shaded Area |
|---|---|---|
| Right-tailed | +1.7613 | Right of value |
| Left-tailed | -1.7613 | Left of value |
| Two-tailed | ±2.1448 | Both ends |
When my test statistic lands in the red zone, I reject the null hypothesis. This visual cue prevents second-guessing. For two-tailed tests, I split the significance level equally—2.5% on each side.
I once mentored a student struggling with p-values. After showing them rejection region diagrams, they exclaimed: “Now I see why my results mattered!” Visuals bridge the gap between theory and real-world decisions.
Through practice, I’ve learned that clear graphs reduce errors in interpretation. They make abstract concepts like degrees of freedom and the distribution of the test statistic tangible. Now, I sketch these diagrams before running any test—it keeps my analysis grounded.
Applications and Examples Using the Calculator
While analyzing clinical trial data last spring, I discovered how modern tools transform statistical workflows. Calculators now handle complex distribution math, letting researchers focus on real-world interpretation. Here’s how I apply these tools across different scenarios.
Practical examples with t-statistics
Imagine testing a new drug’s effectiveness with 16 participants. With 15 degrees of freedom and α=0.05, my calculator returns a right-tailed critical value of 1.753. If the test statistic hits 2.1, we cross this threshold—evidence suggesting actual impact, not random chance.
Real-world interpretation using a critical value calculator
For a 95% confidence interval, I input sample size and desired level. The tool outputs boundaries showing where true population parameters likely reside. This bridges abstract math to decisions like setting safety margins in engineering projects.
Insights from my teaching and research experience
Students often grasp confidence levels faster when they adjust calculator inputs themselves. Changing from 90% to 99% visibly widens intervals—a concrete demonstration of statistical trade-offs. These tools demystify concepts that once required hours with distribution tables.
Major KEY POINTS
Dual-Action Formula:
Delivers a “one-two punch” by raising natural testosterone while suppressing estrogenic effects (blocking aromatase). This balanced approach is designed to maximize male hormone health.Powerful Botanicals:
Includes Tongkat Ali (a Malaysian ginseng) to boost luteinizing hormone and T levels; DIM to detox excess estrogen via the liver; and Acacetin (from damiana) as an aromatase inhibitor This combination is unique compared to basic male supplements.Easy Daily Routine:
Just 2 capsules each morning (no food needed) fits into any lifestyle . The tagline calls it a “10-second solution” for testosterone supportQuality Assured:
Made in a state-of-the-art FDA-registered facility with premium sourcing (non-GMO, gluten-free, hormone-free) Capsules are clear and vegetarian with zero fillers, improving absorption.Money-Back Guarantee:
The product comes with a 60-Day Satisfaction Guarantee , underlining the company’s confidence in its effectiveness.
FAQ
How do I determine when to reject a null hypothesis?
I compare the test statistic to the critical value. If it falls beyond this threshold in the rejection region, I reject the null. The significance level (like 0.05) guides where I set this boundary.
Why does sample size influence my choice of distribution?
Smaller samples often require the t-distribution because it accounts for variability. With larger datasets, I switch to the normal distribution since estimates stabilize.
What’s the relationship between confidence intervals and these values?
Both rely on similar principles. For example, a 95% interval uses quantiles close to the critical thresholds, creating a range where I’d expect the true parameter to lie.
How do I handle one-tailed vs. two-tailed tests in calculations?
For one-tailed, I focus on one end of the distribution. With two-tailed, I split alpha between both sides. This affects where I place rejection regions.
Can I use online tools instead of manual table lookups?
Absolutely. Calculators automate quantile functions, but I always verify results against trusted tables to ensure accuracy, especially with uncommon alpha levels.
What mistakes do beginners often make with rejection regions?
Misaligning the direction of the test (left vs. right-tailed) or forgetting to adjust alpha for two-tailed scenarios. I double-check shading in visualizations to avoid this.
How does degrees of freedom change with different data structures?
It’s tied to sample size and constraints. For a single-sample t-test, I subtract one. In regression models, it depends on predictors. Always recalculate when datasets evolve.